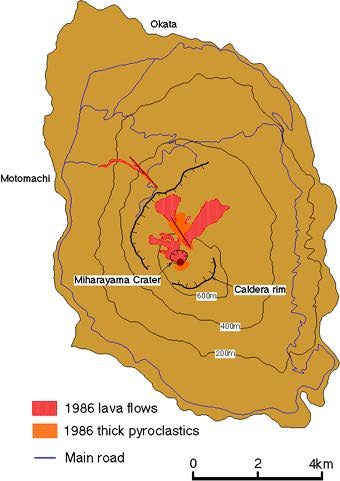
Izu Oshima Volcano is an active volcano, which is located on the northern tip of the Izu-Bonin volcanic arc (Figs. 1 and 2, Photo 1). Detailed syn- and post-caldera eruptive history of Izu Oshima Volcano was recently revealed by tephra and loess stratigraphy (Koyama and Hayakawa, 1996) .

Twenty-four tephra layers, which overlie the slope outside the caldera, show that 24 eruptions occurred since the formation of the caldera (about 1450 years ago) (Photo 2). These eruptions are separated by 10-200 years clear dormant periods, which can be identified by eolian dust (loess) interbedded with tephra layers.
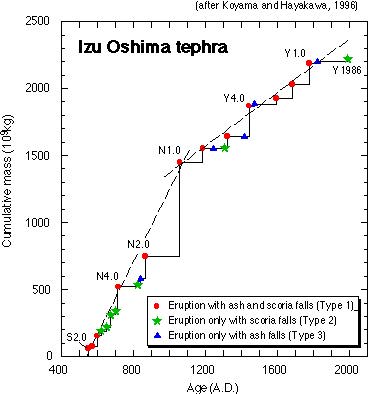
The 24 eruptions can be classified into three types: 1) eruption with scoria and ash falls (12 eruptions), 2) eruption only with scoria falls (7 eruptions), and 3) eruption only with ash falls (5 eruptions). While magma discharge mass of the type 1 is generally large (1.5 x 10^10 to 7 x 10^11 kg), that of the type 2 or 3 is small (0.6 x 10^9 to 1 x 10^11 kg). The 1986 eruption is classified into the type 2 (Fig. 3).
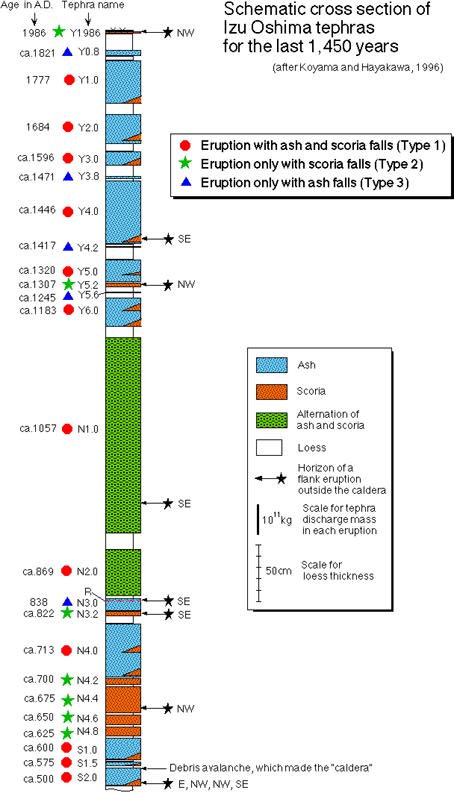
S2.0 debris avalanches, which occurred just before the caldera formation and covered almost all of the Izu Oshima island, demonstrate that the present caldera wall was formed by slope failure of an old edifice.
The tephra-discharge stepdiagram, which shows a relationship between time and cumulative discharge volume/mass of magma, shows: 1) the average tephra discharge rate is constant (92kg/s before the N1.0 eruption and 25kg/s after the N1.0 eruption), showing an abrupt decrease of the rate at about the time of the N1.0 eruption, which occurred about 900 years ago and was the most voluminous eruption for the past 1450 years, 2) both before and after the N1.0 eruption, the type 1 eruption shows volume-predictability, that is, the discharge volume/mass of a next type 1 eruption can be predicted, 3) a type 1 eruption should occur sometime in the future again, and when it occurs, the discharge mass of tephra should attain to as much as 2 x 10^11 kg or more (Fig. 4).
Reference
Koyama, M., and Hayakawa, Y. (1996) Syn- and post-caldera eruptive history of Izu Oshima Volcano based on tephra and loess stratigraphy. J. Geogr., 105, 133-162 (in Japanese with English abstract).